School Performance
Manor Primary School Data
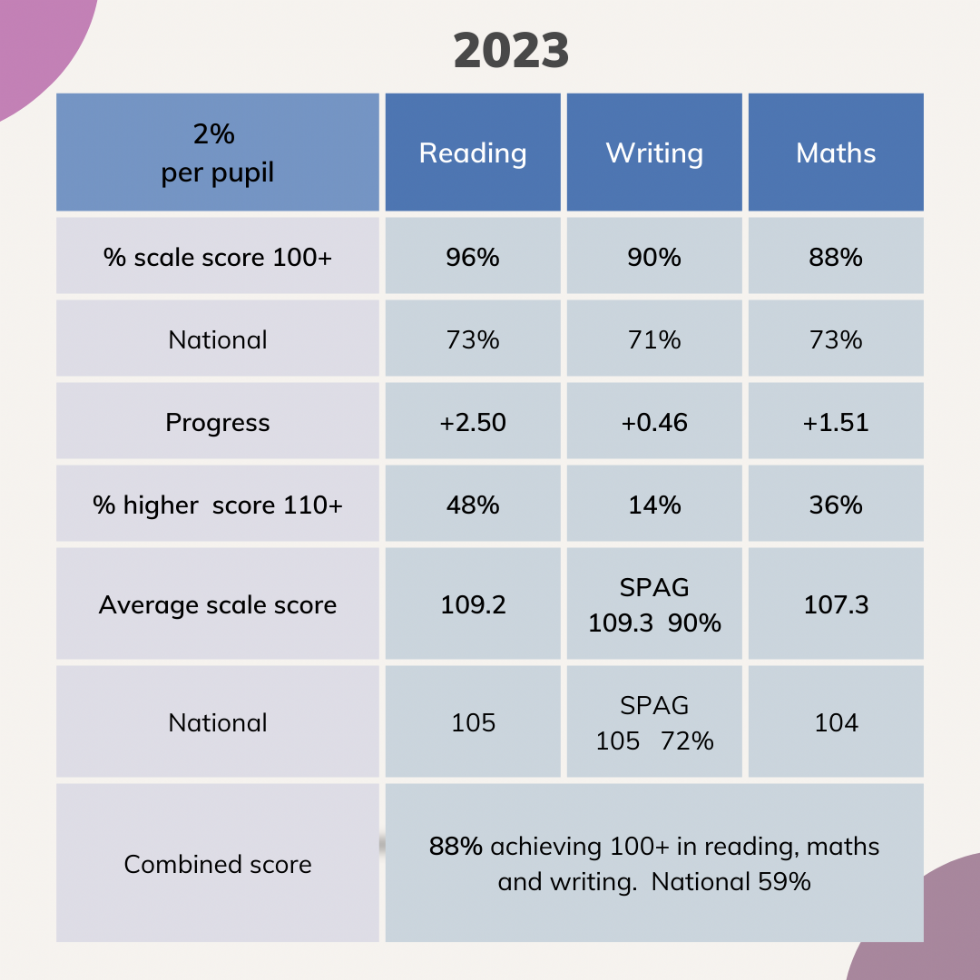
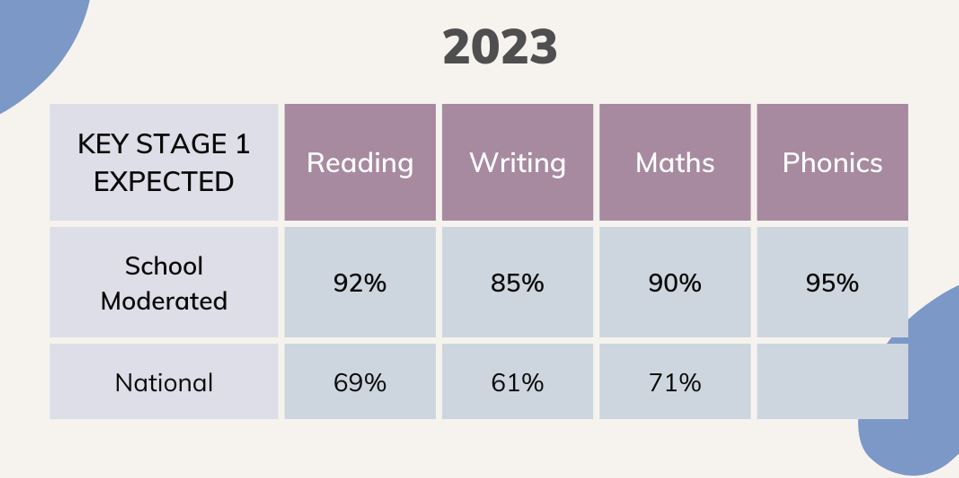
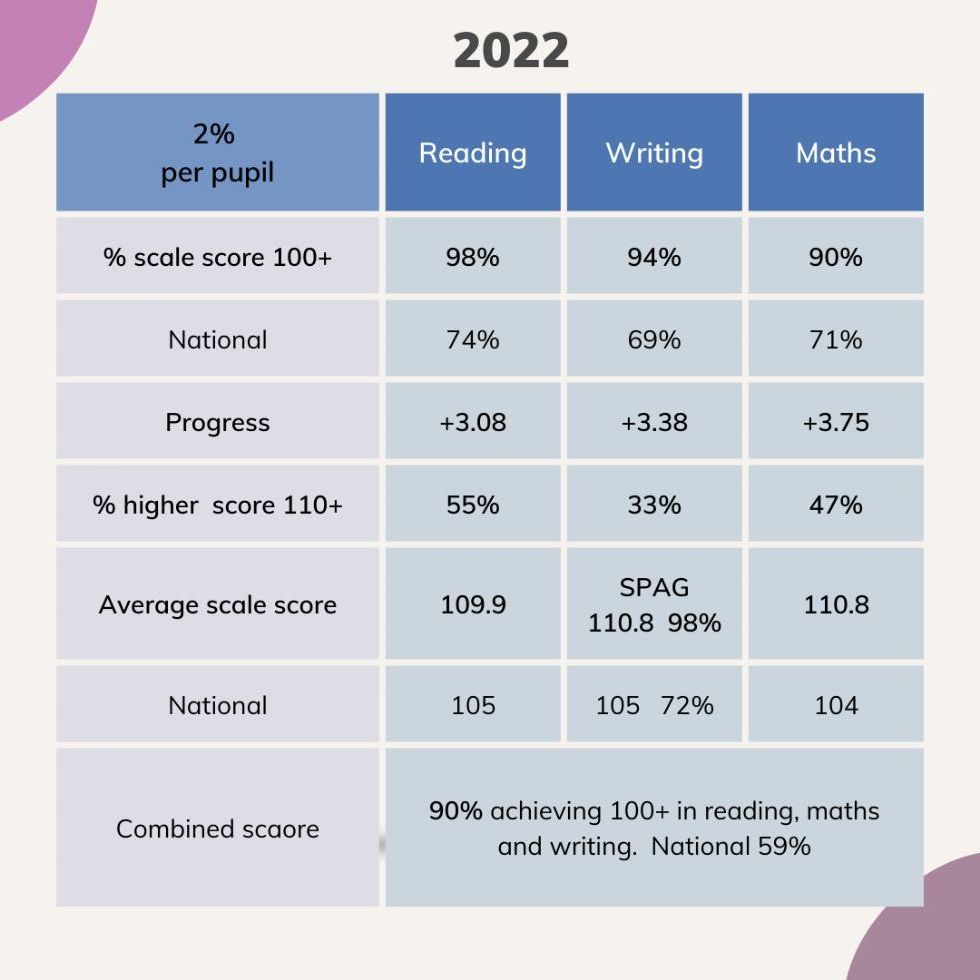
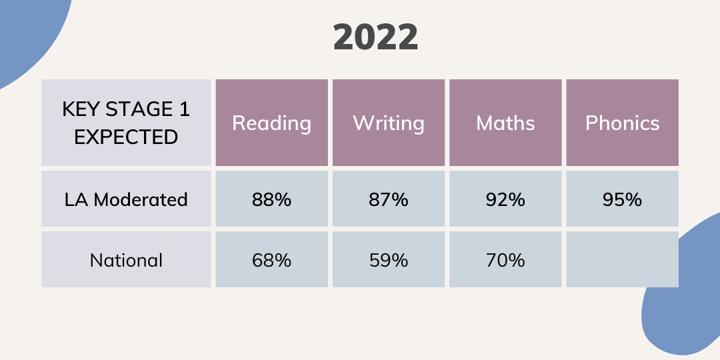
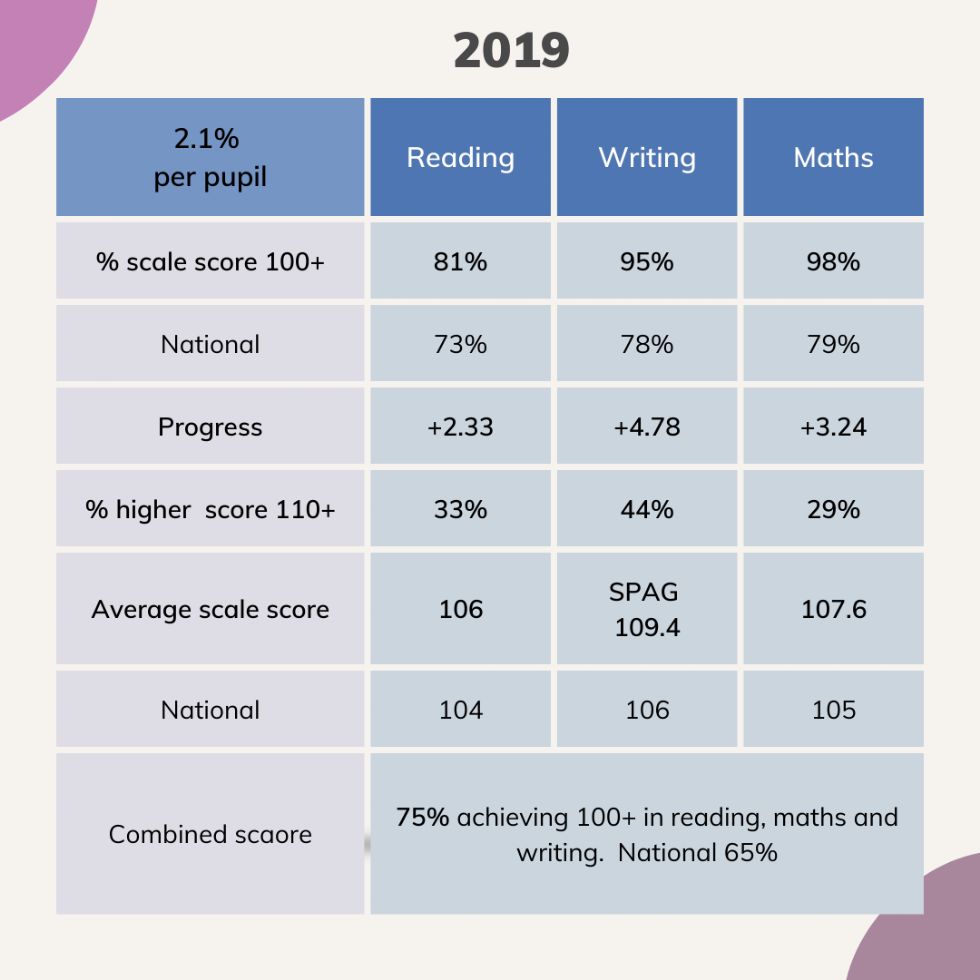
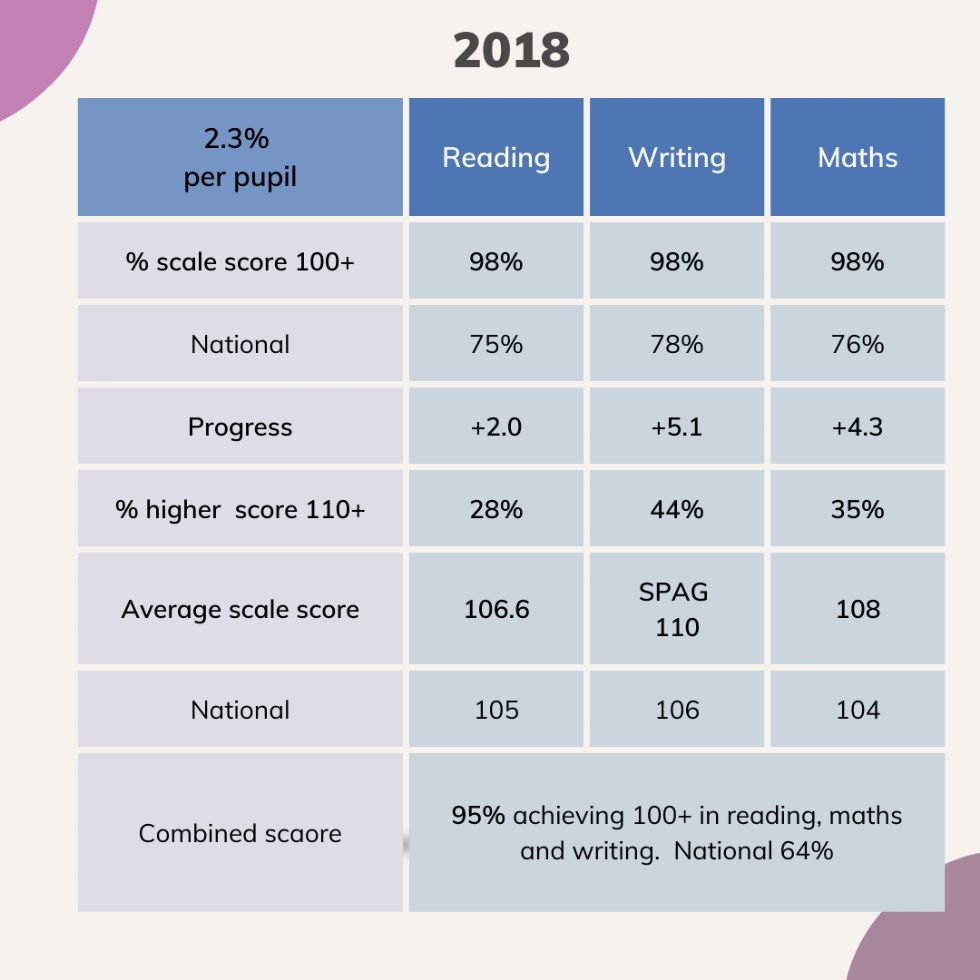
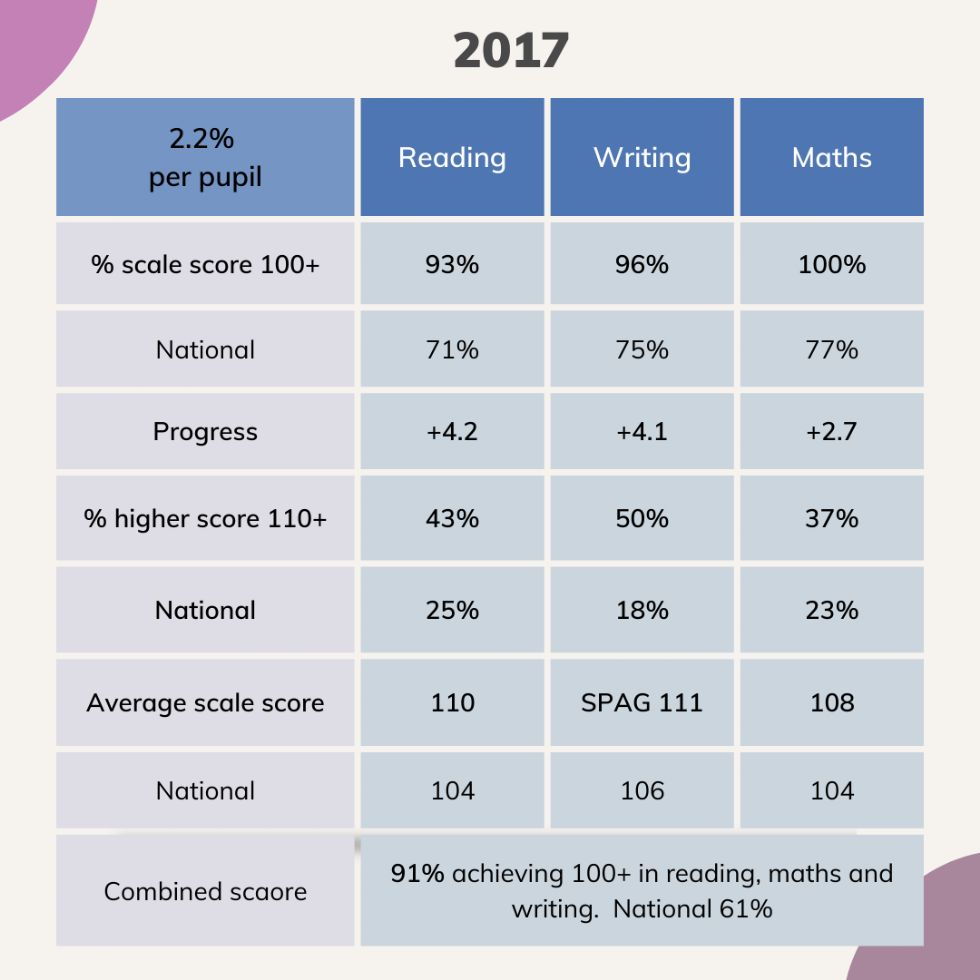
We are delighted that are children continue to achieve year after year above average results in reading, writing and maths.
2019
2.1% per pupil |
Reading |
Writing |
Maths |
% Scale score 100+ |
81% |
95% |
98% |
National |
73 |
78 |
79 |
Progress |
+ 2.33 |
+ 4.78 |
+ 3.24 |
% Higher score 110+ |
33% |
44% |
29% |
Average scale score |
106 |
SPAG 109.4 |
107.6 |
National |
104 |
106 |
105 |
Combined score |
75% achieving 100+ above in reading, maths and writing National 65%
|
2018
2.3% per pupil |
Reading |
Writing |
Maths |
% Scale score 100+ |
98 |
98 |
98 |
National |
75 |
78 |
76 |
Progress |
+ 2.0 |
+ 5.1 |
+ 4.3 |
% Higher score 110+ |
28 |
44 |
35 |
National |
|
|
|
Average scale score | 106.6 | SPAG 110 | 108 |
National | 105 | 106 | 104 |
Combined score |
95% achieving 100+ above in reading, maths and writing National 64% |
2017
2.2% per pupil |
Reading |
Writing |
Maths |
% Scale score 100+ |
93 |
96 |
100 |
National |
71 |
75 |
77 |
Progress |
+ 4.2 |
+ 4.1 |
+ 2.7 |
% Higher score 110+ |
43 |
50 |
37 |
National |
25 |
18 |
23 |
Average scale score | 110 | SPAG 111 | 108 |
National | 104 | 106 | 104 |
Combined score |
91% achieving 100+ above in reading, maths and writing National 61% |
2016
2.9% per pupil |
Reading |
Writing |
Maths |
% Scale score 100+ |
88 |
100 |
85 |
National |
66 |
74 |
70 |
Progress |
+ 0.9 |
+ 5.7 |
+ 1.6 |
% Scale score 110+ |
12 (26 - 109+) |
55 |
29 (36 - 109+) |
National |
19 |
15 |
17 |
Average scale score | 105 | SPAG 108 | 106 |
National | 103 | 104 | 103 |
Combined score |
76% achieving 100+ above in reading, maths and writing National 53% (4 pupils missed 100 by 1 mark in one of these areas - 88%) |
KS1 RESULTS - EXPECTED : READING 93% (Nat 74%) WRITING 93% (Nat 65%) MATHS 89% (Nat 73%) Local Authority moderated GREATER DEPTH - READING 29% (Nat 24%) WRITING 20% (Nat 13%) MATHS 24% (Nat 18%) PHONICS (Y1) 97% (Nat 81%)
2015
2.7% per pupil |
Reading |
Writing |
Maths |
% level 4 and above |
95 |
92 |
92 |
National |
91 |
85 |
87 |
|
|
|
|
% level 5 and above |
59 |
46 |
55 |
National |
49 |
33 |
42 |
89% achieving level 4 & above in reading, maths and writing |
|||
% improved by two or more levels between KS 1 & KS 2 |
91
|
94 |
91 |
National |
91 |
93 |
89 |
2014
2.3% per pupil |
Reading |
Writing |
Maths |
% level 4 and above |
100 |
98 |
98 |
National |
89 |
85 |
86 |
|
|
|
|
% level 5 and above |
73 |
48 |
57 |
National |
49 |
33 |
42 |
|
|
|
|
% improved by two or more levels between KS 1 and KS 2 |
100
|
98 |
96 |
National |
91 |
93 |
89 |
For further assessment information please click the links below:
http://dashboard.ofsted.gov.uk/dash.php?urn=104210
http://www.education.gov.uk/cgi-bin/schools/performance/school.pl?urn=104210